
This time i chose a case study about Fashion. As a woman, I have to admit that fashion is really an ever-ending story. Fashion enthrals everyone. Shopping, nowadays, is more easily for people with internet. However, in today-digital, it’s not simply just put some pictures on the website and hope everyone goes along with that. It’s about creating and experience, and ideally, telling story. In this project, i will build Fashion Retailers Analytics Story with Tableau. This story is about how the business is going on, how the consumer engagement as well as customer lifecycle is and what the company should focus on in the next steps, especially in digital area.
I started a little bit differently from the project Sales Management Analysis. Instead of beginning with the user requests, i started with data exploration to see what information available for analytics purposes, and then looked to the requests of fashion retailer, which metrics or visuals can be processed, lastly built a story to satisfy the needs of user as well as uncover other insights. Noted that the dataset is already cleansed.
Explore data
Dataset consists 2 tables: consumer and purchase, join 2 tables on Customer ID
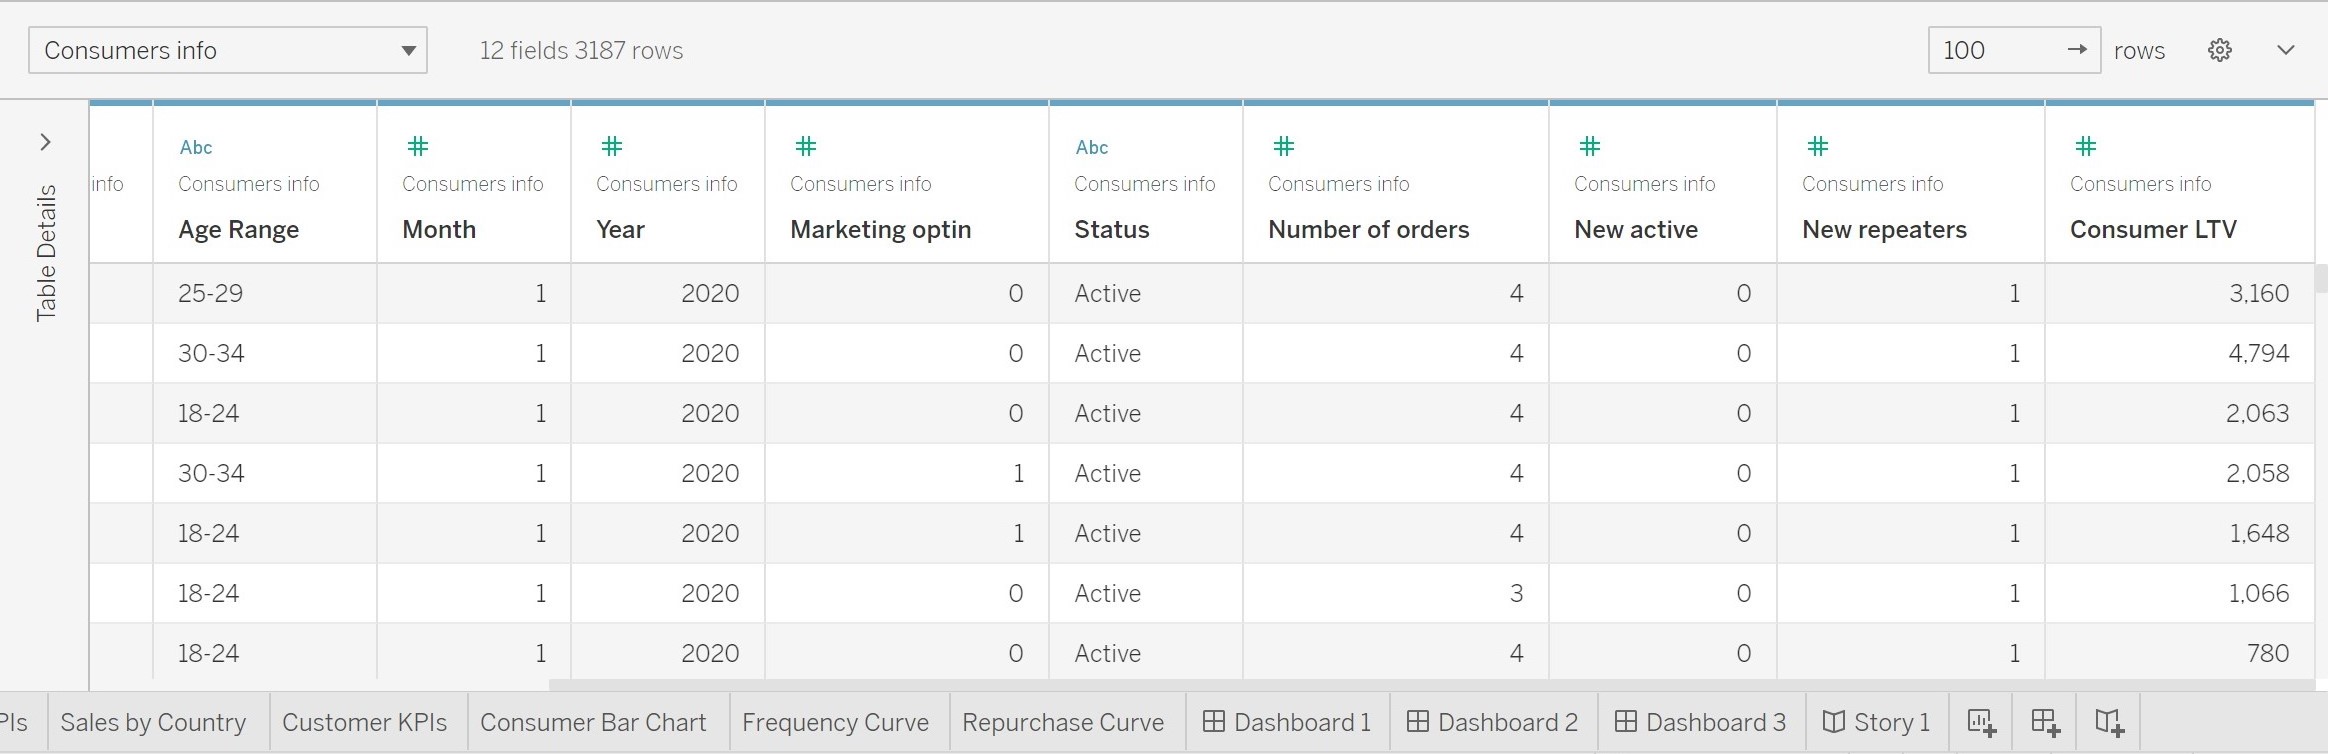
In the table Consumer information, we have some important things, such as:
1.Geodemographic data (gender, country, age ranges) to define customer profile and analyse which product they bought most).
2. Active user is a customer who has placed an order in the last 12 months. Number of orders, whether customers are new active users.
3. New repeat users have made at least one purchase in the last 12 months and have at least one other order. It’s important customer profile because they are the new user interacted to the platform, be convinced with the quality and services, then repeated the order (based on monthly value).
4. Consumer life time value LTV = order value – cogs (for all purchases by a single consumer). I used average consumer LTV, to show the average value customer spent per each order Furthermore, i divided into 3 types of customer Tiers basing on their consumer life time value. This help me figure out which consumer cluster brings the most profit for the business.
| Tier | Consumers LTV |
| Tier 1 | ( 0, 0.33) |
| Tier 2 | (0.33, 0.66) |
| Tier 3 | (0.66,1) |
Purchase Information includes:
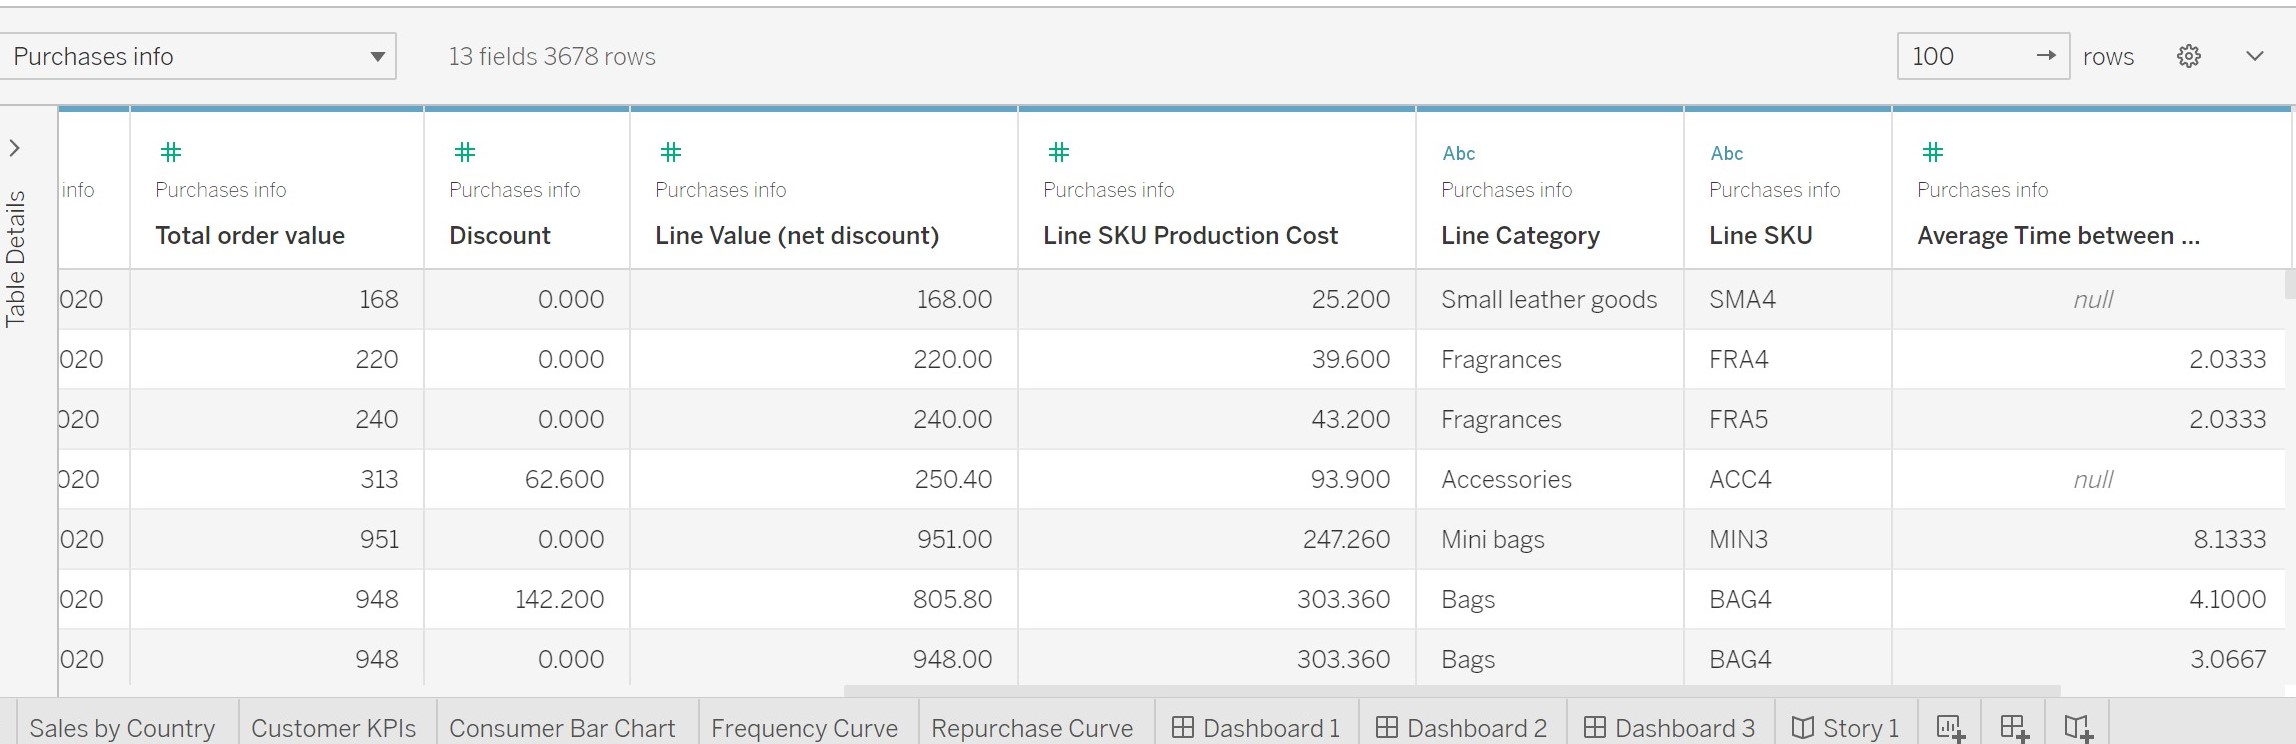
4 column connected to prices, to determine the company KPI, net sales, profit margin.
Total order value is purchase cost for each order pre discount. Basing on this value, i calculated average order value (AOV) to show how much has a consumer spent on average for each individual order.
AOV = Sum(total order value/count(order id)
Line value (net discount)= total value – discount.
Line SKU production cost shows how much it costs to manufacture an item.
Line Category of business consists of: accessories, mini bags, bags, fragrances.
Average time between products shows average months between each purchase for repeat customer and to track average period between re-purchases.
Business Request
| No | Request of Fashion Retailer | User Value | Acceptance Criteria |
| 1 | To get Company KPIs Table, Net Sales | Can follow better how much the consumers will spend for the entire time they’re a consumer on our website. | Filter net sales, gross profit, other metrics according to country |
| 2 | Sales by Country | Can display the countries according to the number of orders | Filter number of order by country |
| 3 | Customer KPIs | the company can identify consumer clusters, then target the right customer base and attract future consumers with the same profile. | Bar chart metric |
| 4 | Frequency of Consumer | to track how the items are served on the way to complete every purchase and to know the average time of customer to repurchase. | Frequency Curve, Repurchase Frequency Curve |
Telling Story
Below is screenshots of the story after built each appropriate charts were read into Tableau.
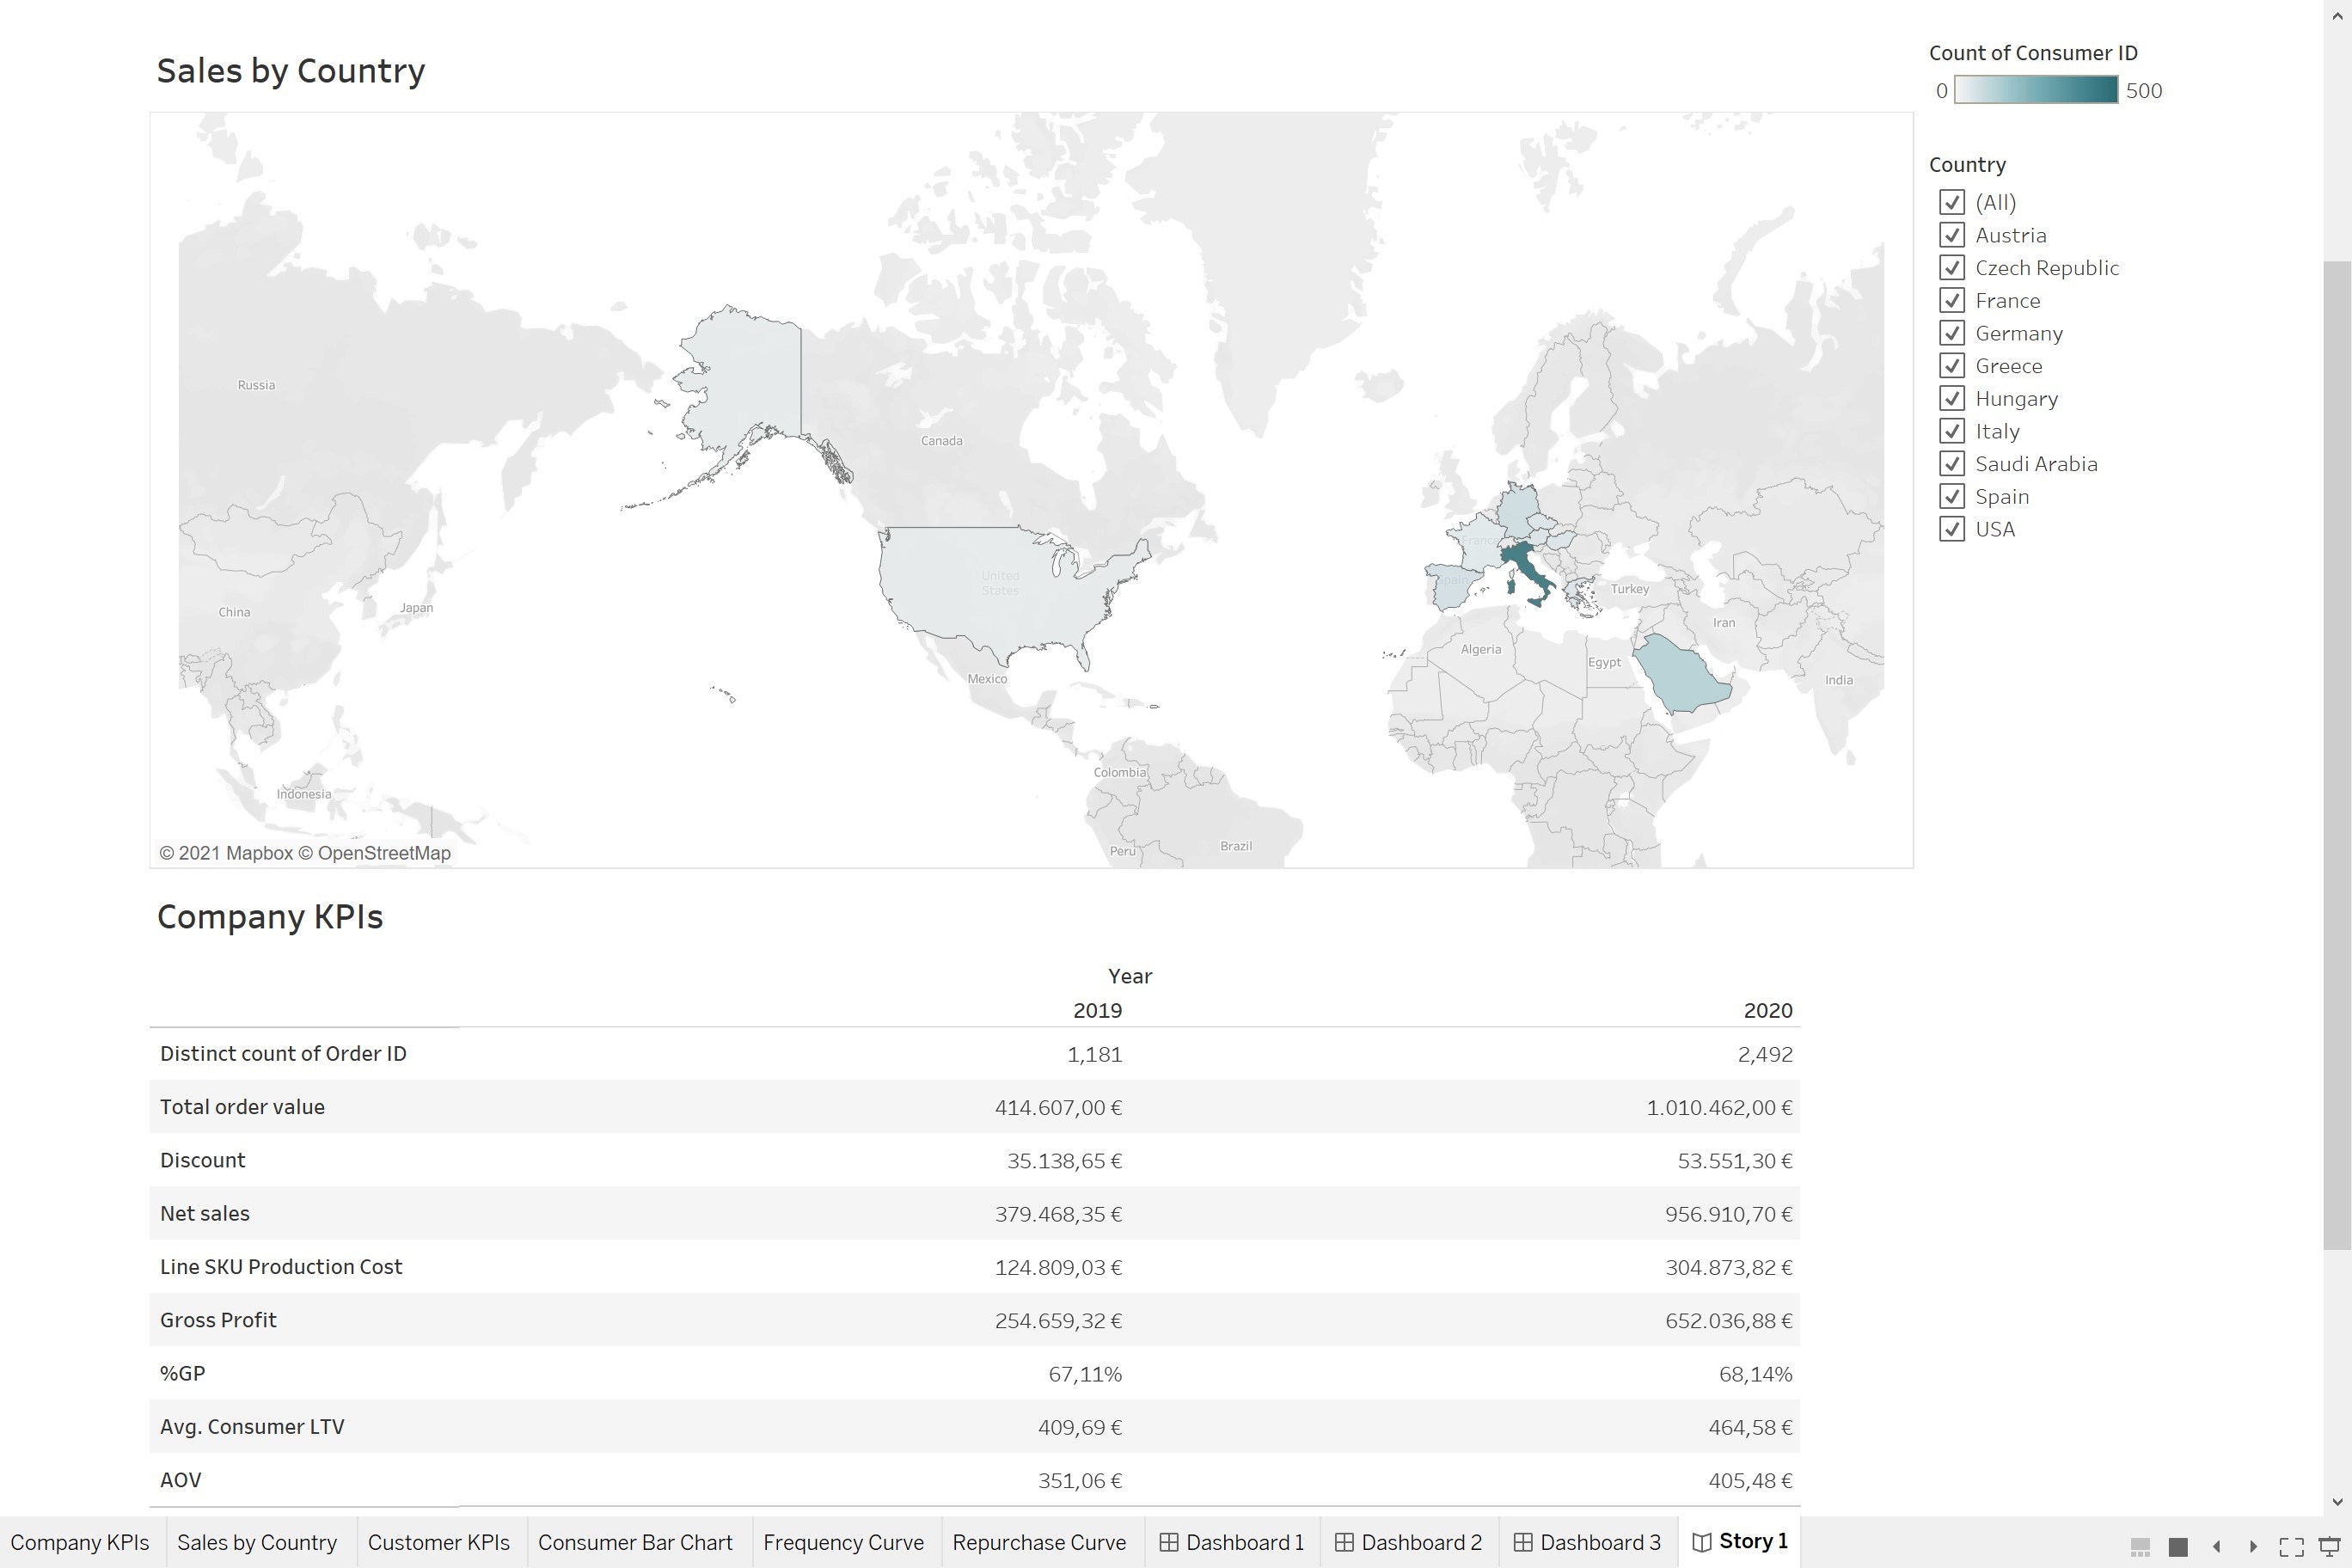
The first part of the story shows company metrics. The story begins with the overview of the company KPIs. This is the number of consumers across countries. In company KPIs, we can see the important metric such as: Net Sales, gross profit margin, the number of orders as well as average of order value of purchases. As we can see, there is a 1% increase in %GD in 2020 compared to 2019 and in 2020 we made more sales compared to previous year, more than double the sales. Naturally it shows an increase in total order value discount in gross sales. The gross profit margin determines the growth.
By adding the country filter to see how the company has been performing in different countries when looking to reserved regions in main part of territory, and as the same time it help us to identify key problem areas, for instance, to show declining in sales from previous year in specific region…
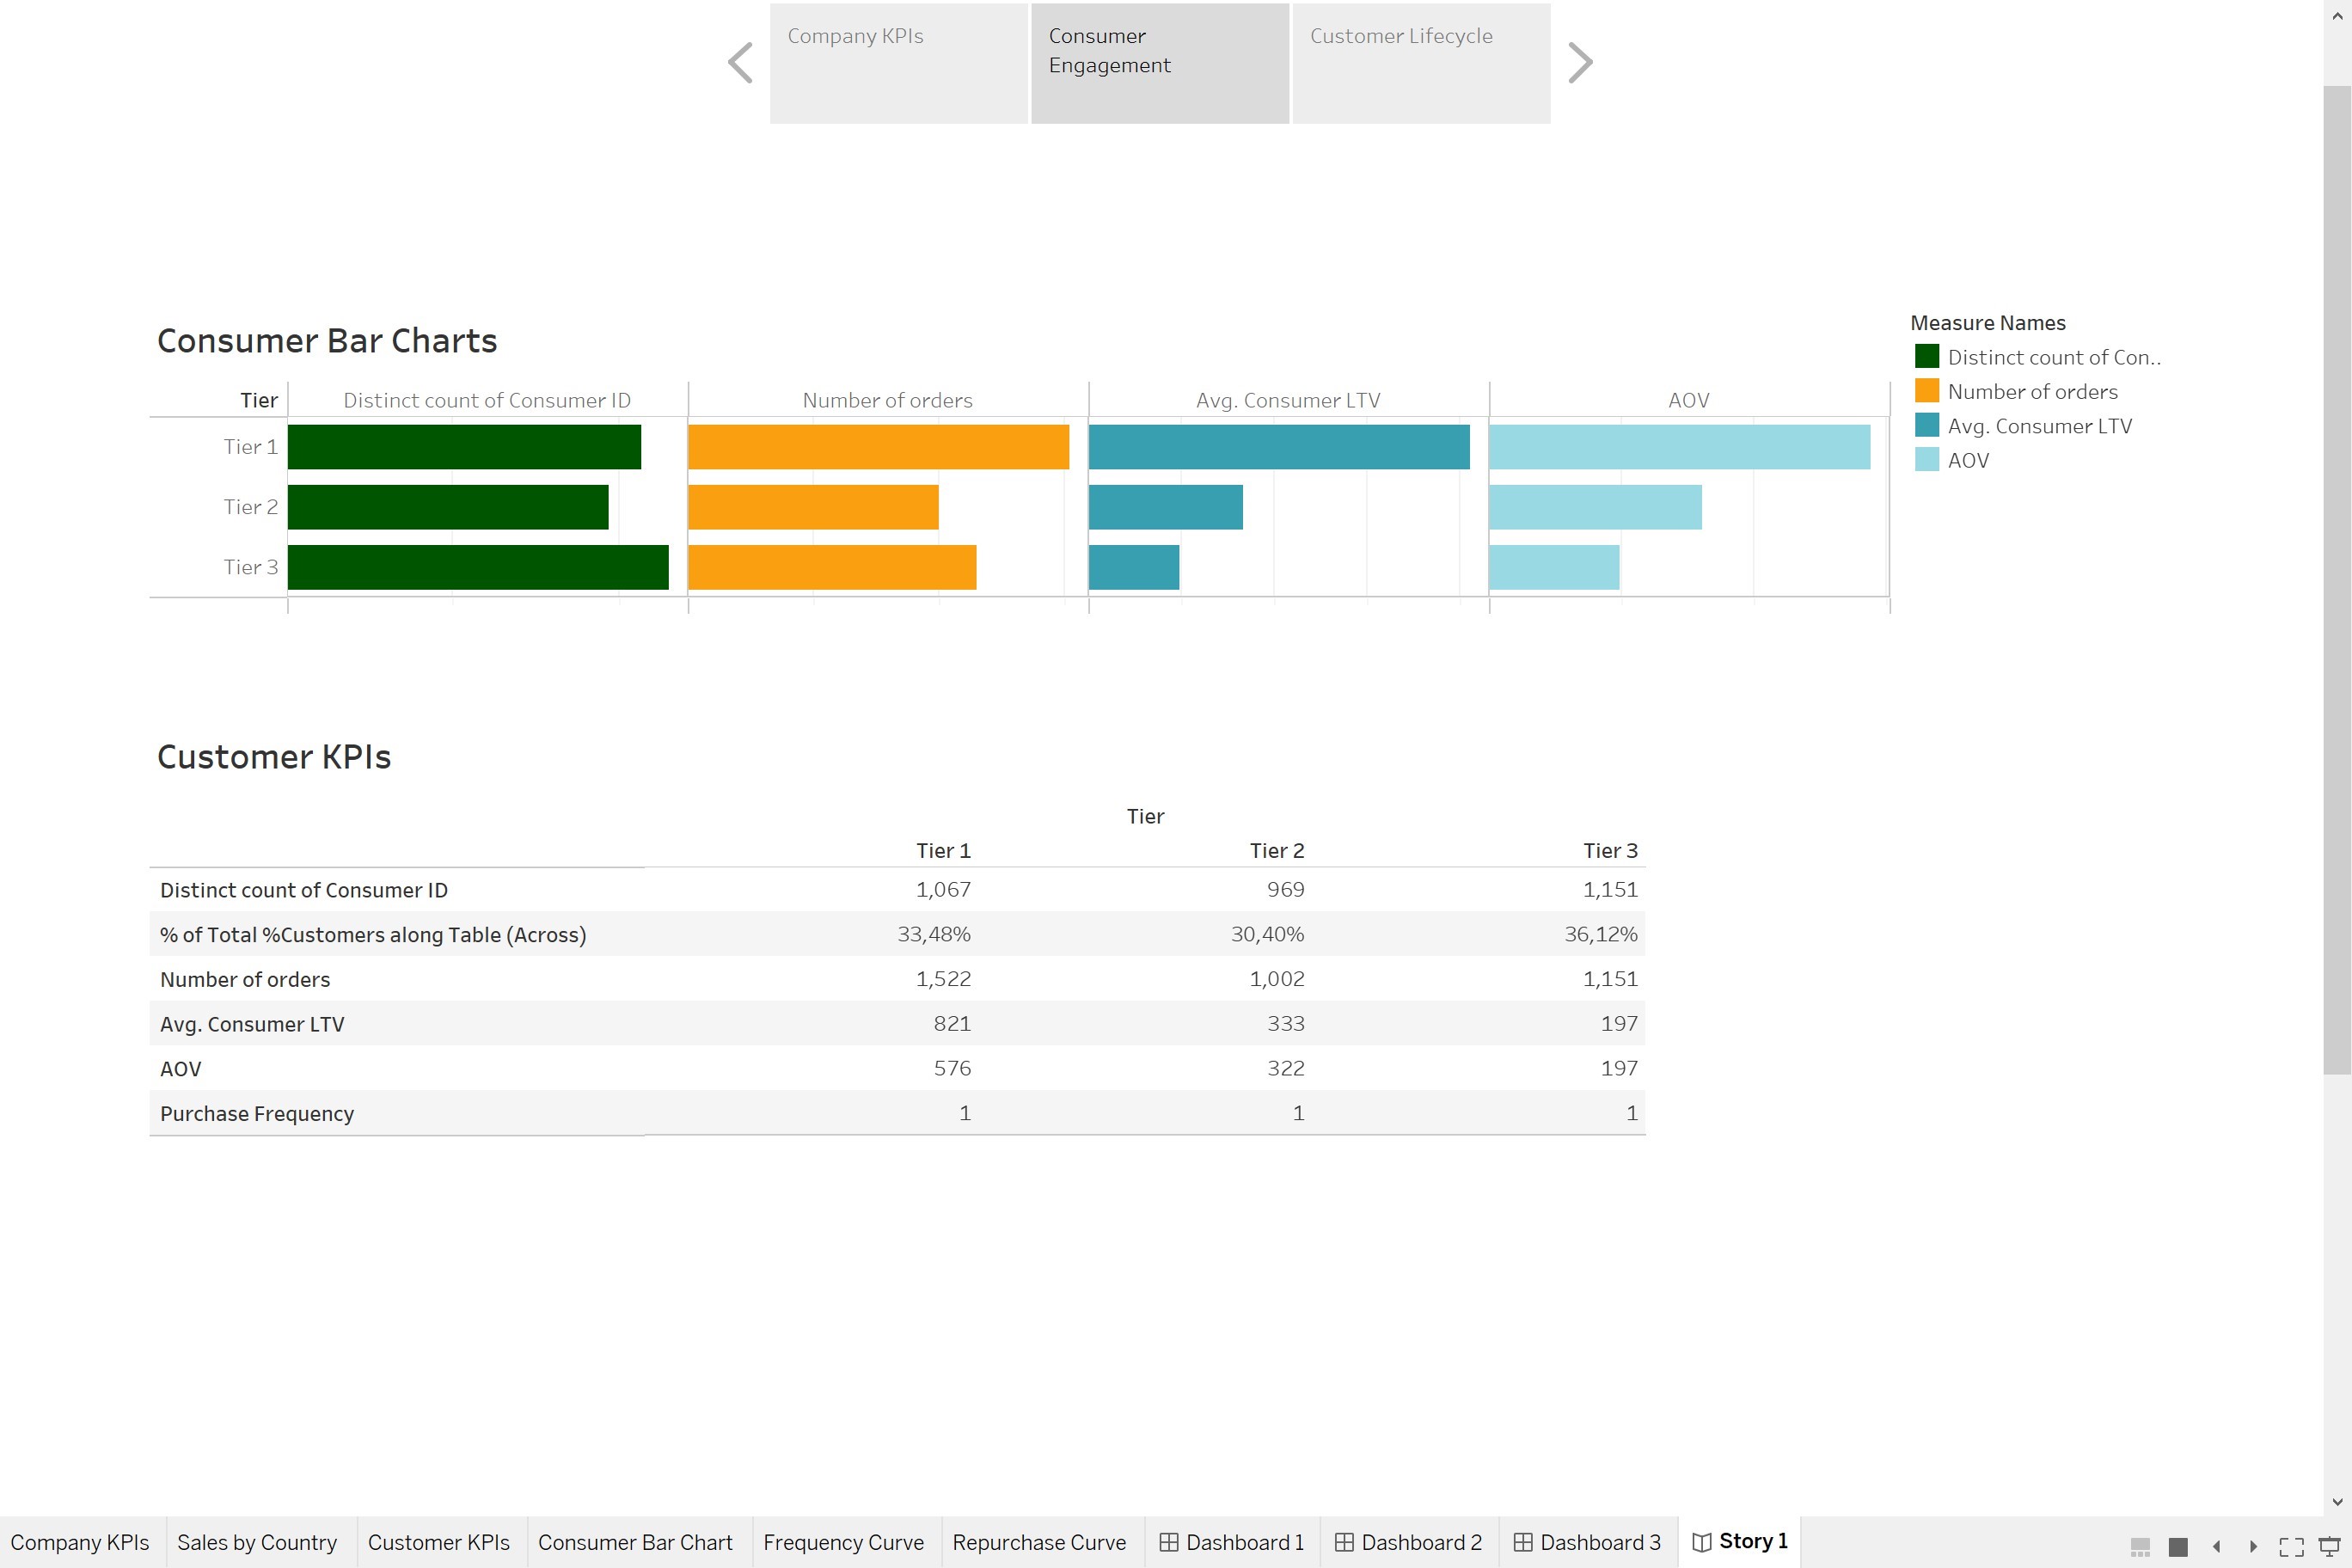
Let’s continue the journey and analyse the consumer engagement. Here we have consumer- driven metric divided by consumer tier. Tier 1 is the pane having highest order, makes up for the smallest consumer cluster (25.01%). Nonetheless, they reach the number of orders (3127) almost 3 times compared to any other 2 clusters.
More importantly, the average order value AOV of Tier 1 (609) is 3 times as high as that of Tier 3 (203). While the lowest pane customer Tier 3 has the AOV almost twice as high as that of the second tier. Clearly, Tier 1 outperforms the rest. Therefore, the company should keep this customer cluster in website where marketing focuses campaign on requiring new users with the same profile.
Alright, i save the best for last. Here is an interesting part of story.
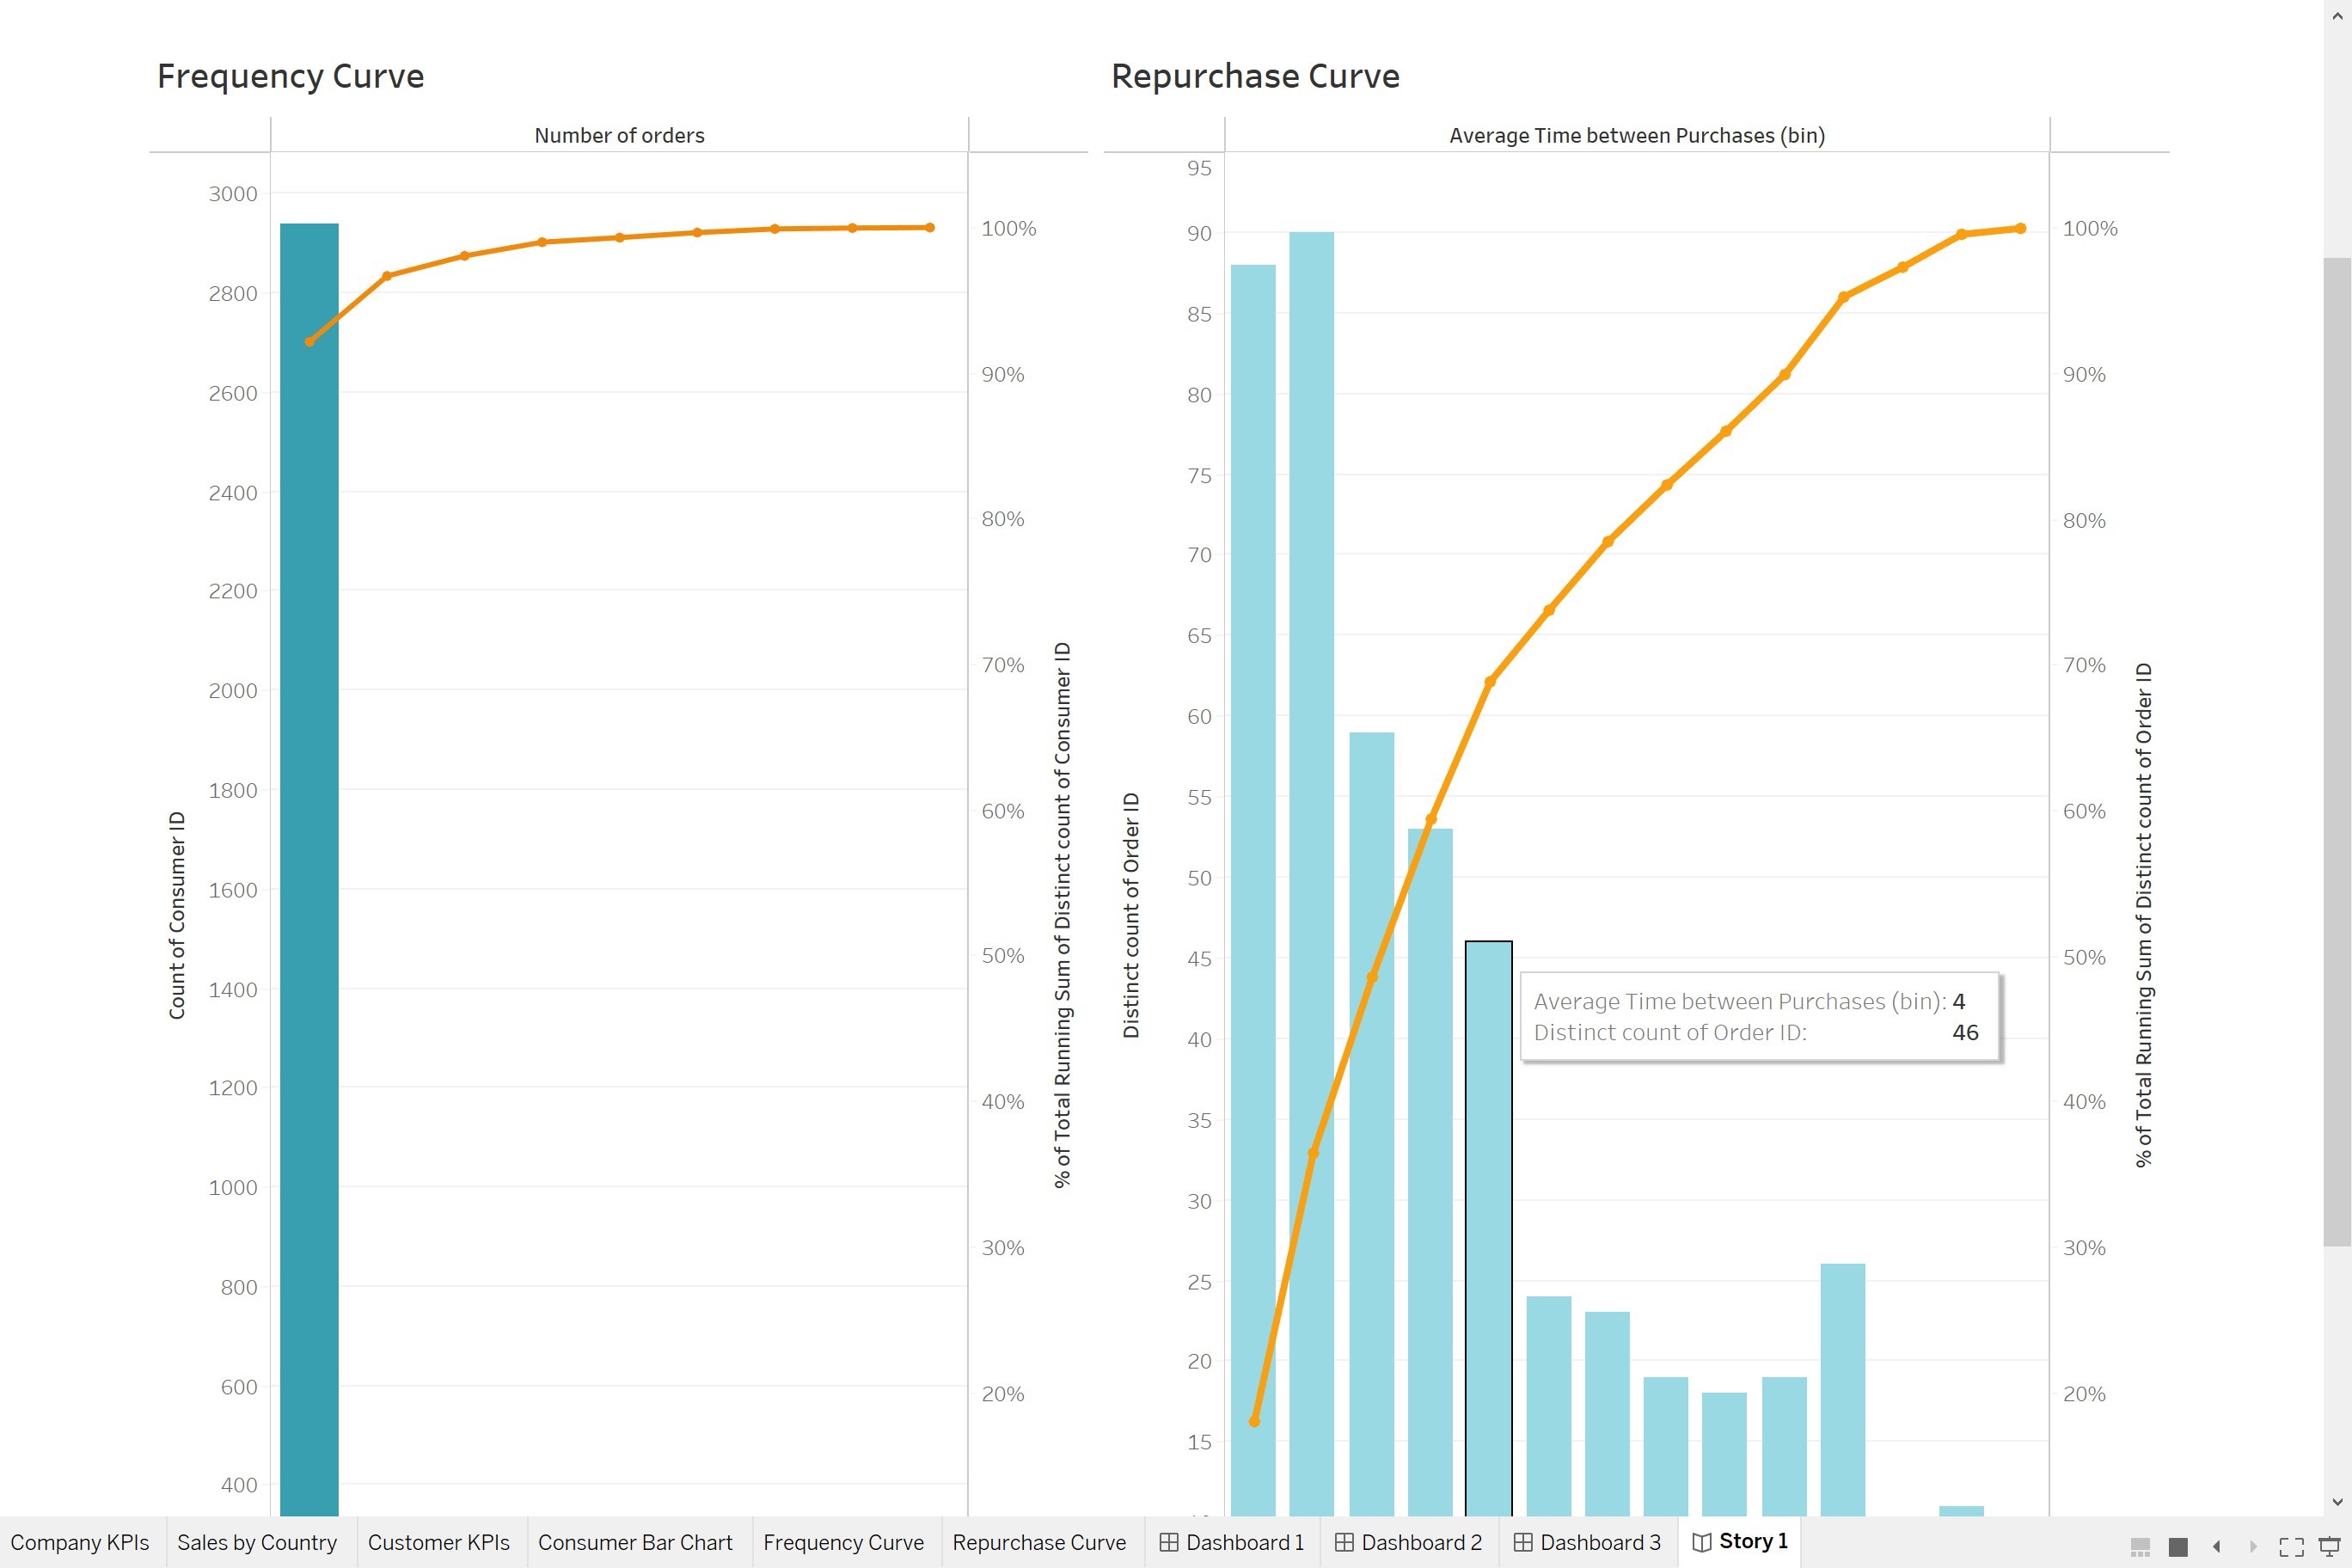
Looking at Frequency Curve, it’s so clearly that most of our consumer base has made single purchase on the website. This is to be expected, the company should focus its efforts on convincing customers to stay active and make repeat purchases. Including but not limited, how the item served on the way to complete every purchase. The customer’s journey has to be flawless and engaging.
The last stop is the repurchasing curve. The average time it takes from the majority of customer to repurchase is a crucial element. It determines when we must target our consumer base before the customers become inactive and the company lose them. Most the part of consumers repurchase in few months. Almost 70% of repurchases come after 4 months. This indicator show that this data comes from a fast fashion brand rather than a luxury one. So this is a part of the graph we should focus on and target new active customers in the first few months of their first purchase. Later that could be potentially convert them into repeater. Therefore, frequency and repurchase frequency curves are the key metrics for the business to measure consumer base.
By combining financial metrics and consumer metrics, this story helps the company understand better its customers. This is just one of data analytics advantages. We still can do further with data, for instance, exploring the consumer trend, market conditions, improving and automating the business platform… in order to bring higher margin and develop the business.
I definitely believe that data analytics and data-driven decision-making are the key into success in today digital area.
