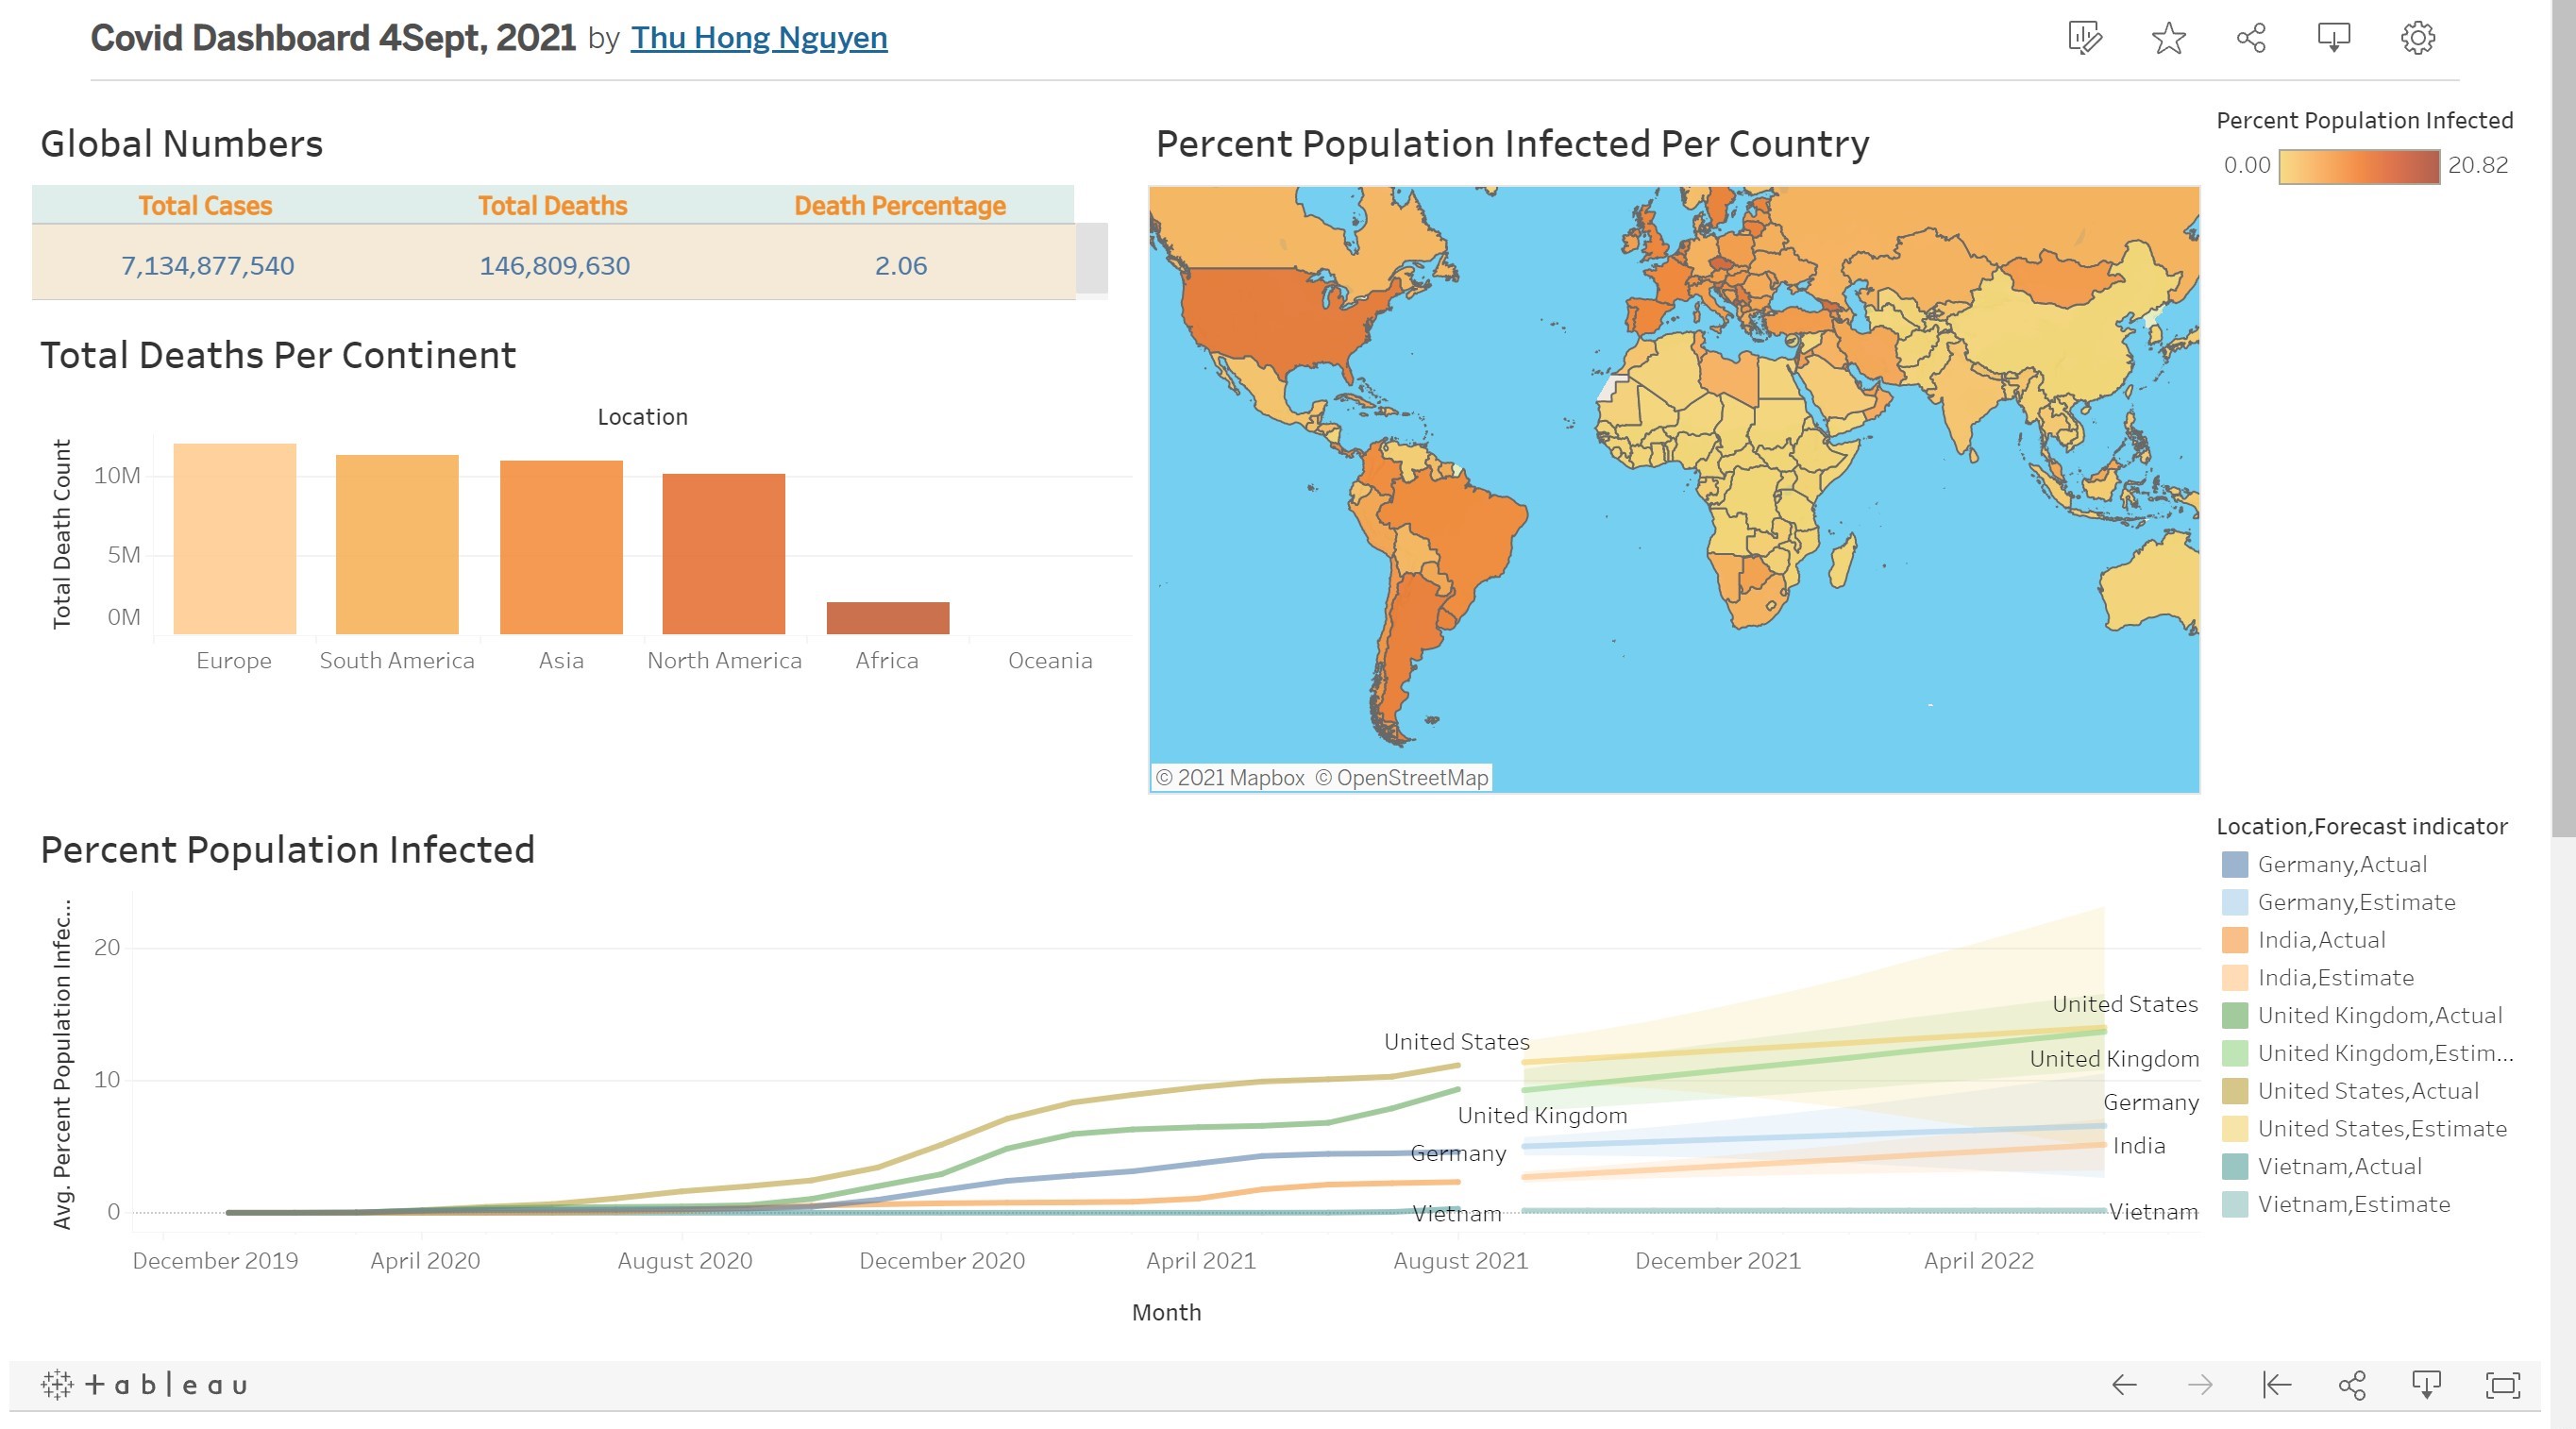
In this project i want to know the Covid19 Situation on over the world, such as: the global number of Covid19 cases, percentage of deaths as well as percentage of people vaccinated per country.
I applied SQL Server to explore global COVID 19 data. Then, visualize it with Tableau.
--Select Data that we are going to be using

Select Location, date, total_cases, new_cases, total_deaths, population
From PortfolioProject..CovidDeaths
Where continent is not null
ORDER BY 1,2
-- Total cases vs Total Deaths
--shows possibility of dying if you are infected with covid in your country
Select Location, date, total_cases, total_deaths,(total_deaths/total_cases)*100 as DeathPercentage
from PortfolioProject..CovidDeaths
Where location like '%states%'
and continent is not null
ORDER BY 1,2
--- Total cases vs population
-- what percentage of population got covid
Select Location, date, total_cases, Population,(total_cases/population)*100 as InfectionPercentage
From PortfolioProject..CovidDeaths
Where location like '%states%'
and continent is not null
ORDER BY 1,2
-Countries with Highest Infection Rate Compared to Population
Select Location, Population,MAX(total_cases) as HighestInfectionCount, MAX((total_cases/population))*100 as
PercentPopulationInfected
from PortfolioProject..CovidDeaths
----where location like '%states%'
where continent is not null
Group by Location, Population
order by PercentPopulationInfected desc
--showing countries with highest Death Count per Population
Select Location, MAX(cast(total_deaths as int)) as TotalDeathCount
from PortfolioProject..CovidDeaths
--where location like '%states%'
where continent is not null
Group by Location
order by TotalDeathCount descBREAK DOWN BY CONTINENT
--Showing continents with the highest death count per population

Select continent, MAX(cast(total_deaths as int)) as TotalDeathCount
from PortfolioProject..CovidDeaths
--where location like '%states%'
where continent is not null
Group by continent
order by  TotalDeathCount desc


-- Global Numbers
--showing DeathPercentage of The World

Select SUM(cast(new_cases as float)) as total_cases, SUM(cast(new_deaths as float)) as total_deaths
,SUM(cast(new_deaths as float))/SUM(cast(new_cases as float))*100 as DeathPercentage
From PortfolioProject..CovidDeaths
--Where location like '%states%'
where continent is not null
--Group By date
ORDER BY 1,2
--showing total cases vs total deaths per country, desc order
Select location, SUM(cast(new_cases as float)) as total_cases, SUM(cast(new_deaths as float)) as total_deaths
,SUM(cast(new_deaths as float))/SUM(cast(new_cases as float))*100 as DeathPercentage
From PortfolioProject..CovidDeaths
--Where location like '%states%'
where continent is not null
Group By location
order by 2 desc, 3 desc
--joining 2 tables
select*
from PortfolioProject..CovidDeaths dea
Join PortfolioProject..CovidVaccinations vac
On dea.location = vac.location
and dea.date = vac.date
where dea.continent is not null
order by 3,4
Looking at Total Population vs Vaccinations

--Shows Percentage of Population that has recieved at least one shot Vaccine

Select dea.continent, dea.location, dea.date, dea.population, vac.new_vaccinations
, SUM(CONVERT(float,vac.new_vaccinations)) OVER (Partition by dea.Location Order by dea.location, dea.Date) as RollingPeopleVaccinated
--, (RollingPeopleVaccinated)/(population)*100 as AtleastoneshotVaccine
From PortfolioProject..CovidDeaths dea
Join PortfolioProject..CovidVaccinations vac
	On dea.location = vac.location
	and dea.date = vac.date
where dea.continent is not null
order by 2,3

--Using CTE to perform Calculation on Partition in previous query


With PopvsVac (Continent, Location, Date, Population, New_Vaccinations, RollingPeopleVaccinated)
as
(
Select dea.continent, dea.location, dea.date, dea.population, vac.new_vaccinations
, SUM(CONVERT(float,vac.new_vaccinations)) OVER (Partition by dea.Location Order by dea.location, dea.Date) as RollingPeopleVaccinated
--, (RollingPeopleVaccinated/population)*100
From PortfolioProject..CovidDeaths dea
Join PortfolioProject..CovidVaccinations vac
	On dea.location = vac.location
	and dea.date = vac.date
where dea.continent is not null
--order by 2,3
)
Select *, (RollingPeopleVaccinated/Population)*100
From PopvsVac
- Temporary Table to perform Calculation on Partition By in previous query


DROP Table if exists #PercentPopulationVaccinated
Create Table #PercentPopulationVaccinated
(
Continent nvarchar(255),
Location nvarchar(255),
Date datetime,
Population numeric,
New_vaccinations float,
RollingPeopleVaccinated numeric
)

Insert into #PercentPopulationVaccinated
Select dea.continent, dea.location, dea.date, dea.population, vac.new_vaccinations
, SUM(CONVERT(float,vac.new_vaccinations)) OVER (Partition by dea.Location Order by dea.location, dea.Date) as RollingPeopleVaccinated
--, (RollingPeopleVaccinated/population)*100
From PortfolioProject..CovidDeaths dea
Join PortfolioProject..CovidVaccinations vac
	On dea.location = vac.location
	and dea.date = vac.date
--where dea.continent is not null
--order by 2,3

Select *, (RollingPeopleVaccinated/Population)*100
From  #PercentPopulationVaccinated
QUERIES FOR VISUALIZATION
--1

Select SUM(new_cases) as total_cases, SUM(cast(new_deaths as int)) as total_deaths,
SUM(cast(new_deaths as int))/SUM(New_Cases)*100 as DeathPercentage
From PortfolioProject..CovidDeaths
--Where location like '%states%'
where continent is not null
--Group By date
order by 1,2

--- European Union is part of Europe

--2

Select  location, SUM(cast(new_deaths as int)) as TotalDeathCount
From PortfolioProject..CovidDeaths
--Where location like '%states%'
Where continent is not null
and location in ('Europe', 'Asia', 'North America', 'South America','Africa', 'Oceania')
Group by location
order by TotalDeathCount desc

--3

Select Location, Population,date, MAX(total_cases) as HighestInfectionCount,  Max((total_cases/population))*100 as PercentPopulationInfected
, CAST(date AS DATE) AS date_Date
From PortfolioProject..CovidDeaths
--Where location like '%states%'
Where continent is not null
and location not in ('World', 'European Union', 'International')
Group by Location, Population, date
order by PercentPopulationInfected desc

--4
Select dea.continent, dea.location, dea.date, dea.population
, MAX(vac.total_vaccinations) as RollingPeopleVaccinated
--, (RollingPeopleVaccinated/population)*100
From PortfolioProject..CovidDeaths dea
Join PortfolioProject..CovidVaccinations vac
	On dea.location = vac.location
	and dea.date = vac.date
where dea.continent is not null
group by dea.continent, dea.location, dea.date, dea.population
order by 1,2,3

-- 5.

With PopvsVac (Continent, Location, Date, Population, New_Vaccinations, RollingPeopleVaccinated)
as
(
Select dea.continent, dea.location, dea.date, dea.population, vac.new_vaccinations
, SUM(CONVERT(float,vac.new_vaccinations)) OVER (Partition by dea.Location Order by dea.location, dea.Date) as RollingPeopleVaccinated
--, (RollingPeopleVaccinated/population)*100
From PortfolioProject..CovidDeaths dea
Join PortfolioProject..CovidVaccinations vac
	On dea.location = vac.location
	and dea.date = vac.date
where dea.continent is not null
--order by 2,3
)
Select *, (RollingPeopleVaccinated/Population)*100 as PercentPeopleVaccinated
From PopvsVac

-- 6.

Select Location, Population,date, MAX(total_cases) as HighestInfectionCount,  Max((total_cases/population))*100 as PercentPopulationInfected
From PortfolioProject..CovidDeaths
--Where location like '%states%'
Group by Location, Population, date
order by PercentPopulationInfected desc
Visualisation with Tableau